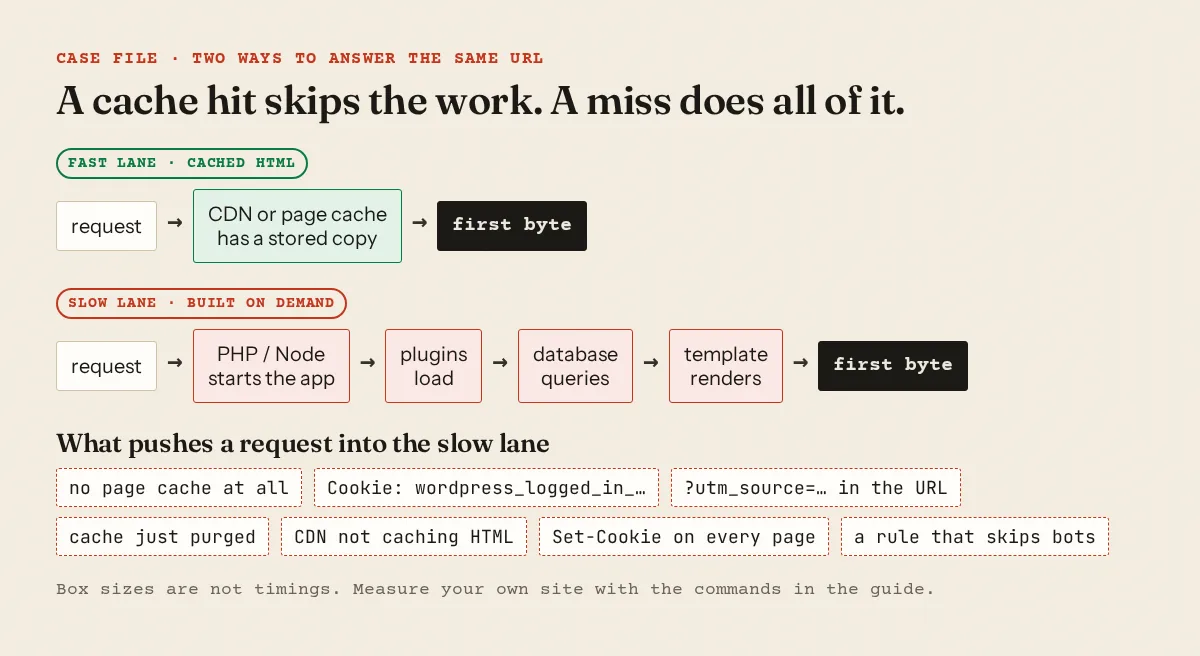
Time to first byte (TTFB) is how long a browser or crawler waits before your server starts sending the page. When it is slow, the most common cause is that the page is being built from scratch on every request instead of being served from a cache. Measure it a few times from a cold start, check whether your cache is actually being hit, and fix caching before you think about changing hosts.
What TTFB includes, and what it is not
web.dev defines it as "the time between starting navigating to a page and when the first byte of a response begins to arrive" (TTFB). That window covers redirects, DNS lookup, connection and TLS setup, and the time your server spends producing the response. Its guidance: "Good TTFB values are 0.8 seconds or less, and poor values are greater than 1.8 seconds."
TTFB is not a Core Web Vital. The same page says "Because TTFB isn't a Core Web Vitals metric, it's not absolutely necessary that sites meet the 'good' TTFB threshold" if the other metrics are fine. It matters because every later milestone, including LCP, waits for it. For LCP, INP, CLS and ad layout shift, see mobile usability and speed for AdSense; this page stays on the server side.
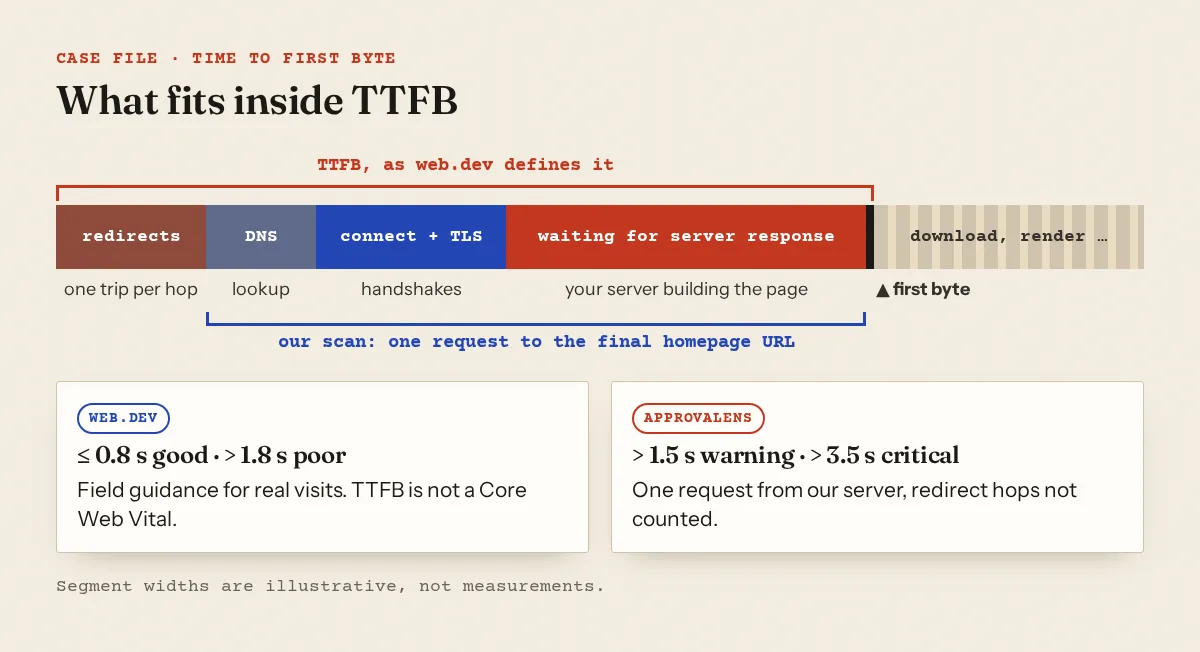
AdSense publishes no TTFB requirement. The practical risk is reachability: a server that answers slowly, or times out under load, is the one that produces "site down or unavailable" (site down guide). Google also crawls a slow site less: "If the site slows down (latency increases or response times become longer) ... the limit goes down and Google crawls less" (crawl budget).
How Approvalens measures it
access.slow_server is based on a single request: the homepage fetch at the start of the scan. It runs from our own server with a desktop Chrome user agent, starting with no cookies, and an Accept-Encoding of gzip and deflate. We time from sending the request to receiving the response headers, for the final URL after any redirects. Earlier redirect hops are not in this number; the redirect chains guide covers those.
| Time to response headers | Result |
|---|---|
| 1,500 ms or less | Pass, with the time shown |
| over 1,500 ms | Warning |
| over 3,500 ms | Critical |
If the server sends nothing for 15 seconds, the request times out and the homepage counts as unreachable. Two related checks look at the same homepage response: tech.compression fires when the HTML is over about 20 KB and comes back without a Content-Encoding header, and seo.html_size fires when the homepage HTML is over 1 MB. The methodology page covers the rest of the scan.
One sample from one place is a snapshot, not an average. Your number can be much better or much worse for honest reasons:
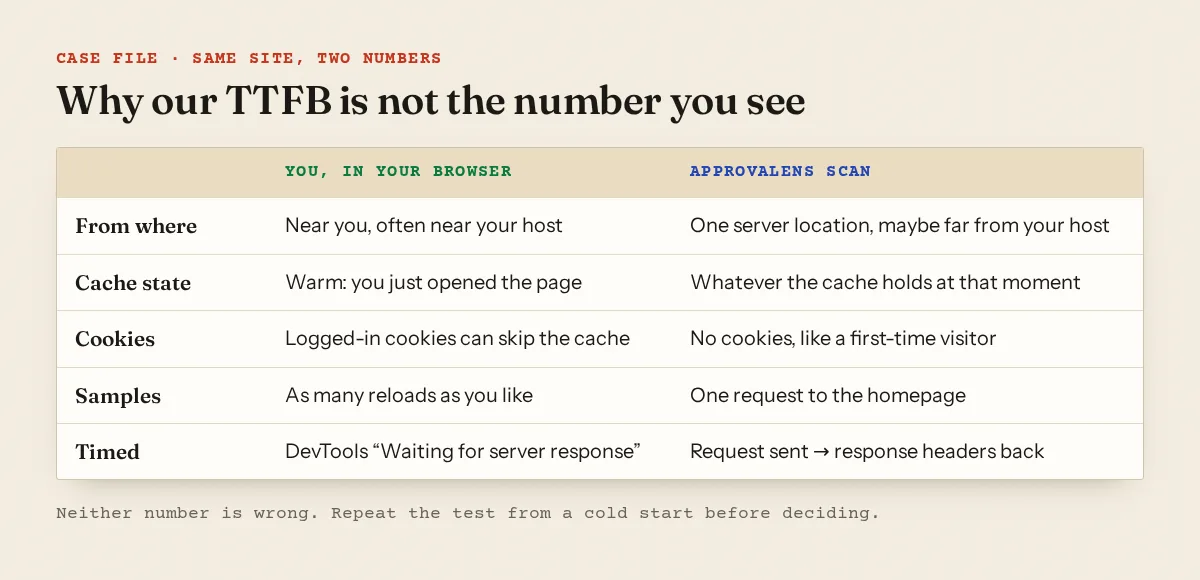
If the scan says 2,400 ms and you see 200 ms, the usual story is that you hit a warm cache and we did not. That still means some real visitors, and crawlers, get the slow version.
Measure it yourself
curl gives you the phases separately. Each value is cumulative from the start, so ttfb already includes DNS, connect and TLS. Run it three times in a row:
$ for i in 1 2 3; do curl -s -o /dev/null -w 'dns %{time_namelookup}  connect %{time_connect}  tls %{time_appconnect}  ttfb %{time_starttransfer}  total %{time_total}\n' https://example.com/; done
dns 0.014  connect 0.052  tls 0.109  ttfb 2.318  total 2.402
dns 0.001  connect 0.038  tls 0.093  ttfb 0.204  total 0.251
dns 0.001  connect 0.037  tls 0.090  ttfb 0.196  total 0.243
This example output is the classic cache pattern: the first request built the page (about 2.2 s of server time), the next two were served from cache. If all three are slow, there is no working cache for this URL at all.
In Chrome DevTools, open the Network panel, reload, click the document request and open the Timing tab. The row Chrome labels "Waiting for server response" (older versions said "Waiting (TTFB)") is your server's think time plus one round trip.
For real-user data, PageSpeed Insights shows TTFB in its field section when Chrome has enough data for your site, marked as "the experimental metric Time to First Byte (TTFB)" with good at 800 ms or less and poor above 1,800 ms (PSI documentation). New sites often have no field data yet.
For Google's side, Search Console's Settings → Crawl stats report shows "Average response time for all resources fetched from your site" (Crawl Stats report). It mixes images, scripts and pages, so read its trend rather than the absolute value. Our free Googlebot access checker fetches your homepage as a browser, a phone, Googlebot, Mediapartners-Google and AdsBot and shows the full response time for each. If the Google rows are consistently much slower than the browser row, something treats crawlers differently.
Is the cache being hit?
Read the response headers before changing anything:
$ curl -sI https://example.com/ | grep -iE '^(cache-control|set-cookie|age|cf-cache-status|x-nextjs-cache)'
cache-control: no-cache, must-revalidate, max-age=0
set-cookie: PHPSESSID=8f2c41d0a7; path=/
cf-cache-status: DYNAMIC
Three problems in three lines. no-cache tells caches not to reuse the page, the session cookie on an anonymous page usually stops caching, and Cloudflare's DYNAMIC means it "determined at request time that the asset is not eligible for cache" (Cloudflare cache statuses). What you want to see on a second request is HIT, or a page cache's own hit header.
Then test the cases a cache commonly skips: add a logged-in style cookie (-H 'Cookie: wordpress_logged_in_test=1'), add ?utm_source=test to the URL, and repeat with -A 'Mozilla/5.0 (compatible; Googlebot/2.1; +http://www.google.com/bot.html)'. If one variant is consistently slow, that is the path your cache does not cover.
Fixes, in the order we check them
1. Turn on a page cache. WordPress's own documentation describes page caching as serving posts "as static files" and notes it "can improve performance several hundred times over for fairly static pages" (WordPress cache docs). Use your host's built-in cache if it has one, or one caching plugin. Not two: two page caches on one site are hard to debug.
2. Let the CDN cache HTML. "The Cloudflare CDN does not cache HTML or JSON by default" (default cache behavior), so being on Cloudflare does not by itself speed up TTFB. A Cache Rule with Eligible for cache can change that, but by default Cloudflare does not cache a response that carries Set-Cookie, and you must bypass the cache for logged-in users, carts and admin paths. If that sounds risky, rely on the origin page cache. The Cloudflare guide covers the firewall settings in the same dashboard.
3. Stop the cache bypasses you do not need. A plugin that sets a cookie for every visitor, a "do not cache" list that includes crawler user agents, or a security layer that does extra work for anything calling itself Googlebot all push requests into the slow lane.
4. Find the slow plugin or query. If uncached requests are slow even on an idle server, the work itself is heavy. Deactivate plugins one at a time on a staging copy and time an uncached request after each, or use a query-profiling plugin to see which component runs the most database queries. More WordPress cleanup is in AdSense for WordPress.
5. Update PHP. WordPress recommends "PHP version 8.3 or greater" and warns that older versions "have reached their official End Of Life" (requirements). The switch is usually a dropdown in your hosting panel; test on staging first.
6. Move closer to readers, or put a cache between. web.dev's TTFB guide starts with hosting, warning that shared hosting tends to be slower, and explains that CDNs cache resources "on servers that are physically closer to your users" (optimize TTFB). If most readers are in one country and the server is on another continent, every uncached request pays for that distance.
7. Next.js: render statically where you can. A route becomes dynamic when it uses request-time APIs such as cookies(), headers() or searchParams. The next build output marks each route ○ (Static) or ƒ (Dynamic). For a blog post that changes rarely, time-based revalidation keeps it static:
// app/blog/[slug]/page.tsx
export const revalidate = 3600 // rebuild at most once an hour
With Cache Components enabled, the equivalent is 'use cache' with cacheLife('hours'). The x-nextjs-cache header shows HIT, STALE, MISS or REVALIDATED, so you can see whether the cache answered.
Compression and HTML weight
These do not change TTFB itself, but they decide what happens right after the first byte.
Check compression with a request that offers it:
$ curl -sI -H 'Accept-Encoding: gzip, deflate, br' https://example.com/ | grep -i '^content-encoding'
content-encoding: br
No content-encoding line means the HTML went out uncompressed. Google's crawlers "support the following content encodings (compressions): gzip, deflate, and Brotli (br)" (Google crawlers). Our scan offers only gzip and deflate, so a server that compresses with Brotli but has no gzip fallback is flagged; enabling gzip alongside Brotli fixes it for us and for older clients.
For size, Googlebot "crawls the first 2MB of a supported file type", and "The file size limit is applied on the uncompressed data" (Googlebot). Our 1 MB seo.html_size notice is meant as an early warning. The usual causes are base64 images in the HTML, inline SVG icon sets, page-builder markup repeated per block, and a homepage that lists 50 full posts. Paginate the homepage and move embedded assets to files.
Once caching and compression are in place, a free scan re-measures the homepage from our side so you can compare.
FAQ
What TTFB do I need for AdSense approval?
There is no published number. Aim for web.dev's 0.8 seconds for real visitors, and make sure the site never times out. Approvalens warns above 1.5 seconds and treats above 3.5 seconds as critical.
My host says the server is fast. Why is TTFB slow?
Often the hardware is not the bottleneck. A fast server still takes time if each request starts PHP, loads every plugin and queries the database. Compare a cached and an uncached request with curl to see the difference.
Should I make Cloudflare cache all my HTML?
Only if you also bypass the cache for logged-in users, comments in moderation, carts and admin paths, and nothing sets cookies for anonymous visitors. Otherwise visitors can get pages meant for someone else. An origin page cache is the safer first step.
Does a CDN fix TTFB on its own?
Not for HTML unless the CDN is configured to cache it. Images, CSS and JavaScript benefit by default; the HTML document still comes from your server each time.
Spotted something out of date or wrong? Tell us and we'll correct it.
Read this guide in Turkish →Check it on your own site. Free, no sign-up.
Free tools for this
Free scan
Check your own site
Free scan: readiness score and every issue, usually in a few minutes.